11. Linear models with a single factor explanatory variable having three or more levels (One-way analysis of variance)#
本节需要的包:
require(s20x)
require(dplyr)
require(emmeans)
Show code cell output
载入需要的程辑包:s20x

Warning message:
"程辑包's20x'是用R版本4.2.3 来建造的"
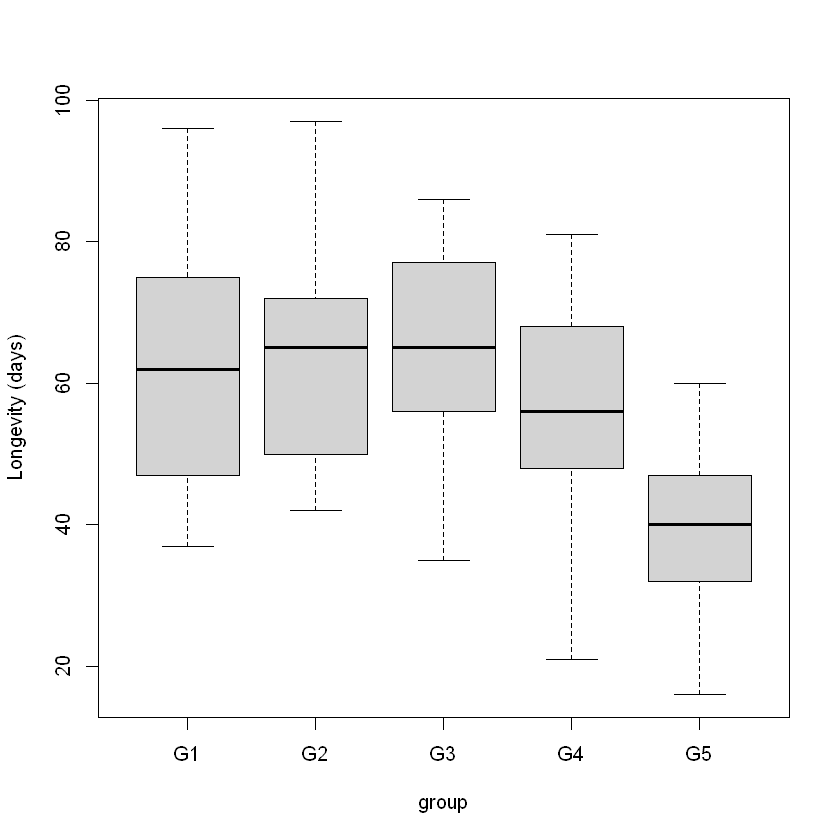
11.1. Example with a 5-level explanatory factor variable#
The explanatory factor variable was group, with five levels:
G1 males living alone,
G2 males living with one interested female,
G3 males living with eight interested females,
G4 males living with one uninterested female, and
G5 males living with eight uninterested females.
Let us take a look at the data:
library(s20x)
Fruitfly.df <- read.csv("../data/Fruitfly.csv", header = T)
Fruitfly.df$group <- factor(Fruitfly.df$group)
boxplot(days ~ group, data = Fruitfly.df, ylab = "Longevity (days)")
As seen in previous chapters that involved categorical explanatory variables, our model specification uses indicator variables. In this case:
Fruitfly.fit <- lm(days ~ group, data = Fruitfly.df)
plot(Fruitfly.fit, which = 1)
normcheck(Fruitfly.fit)
cooks20x(Fruitfly.fit)
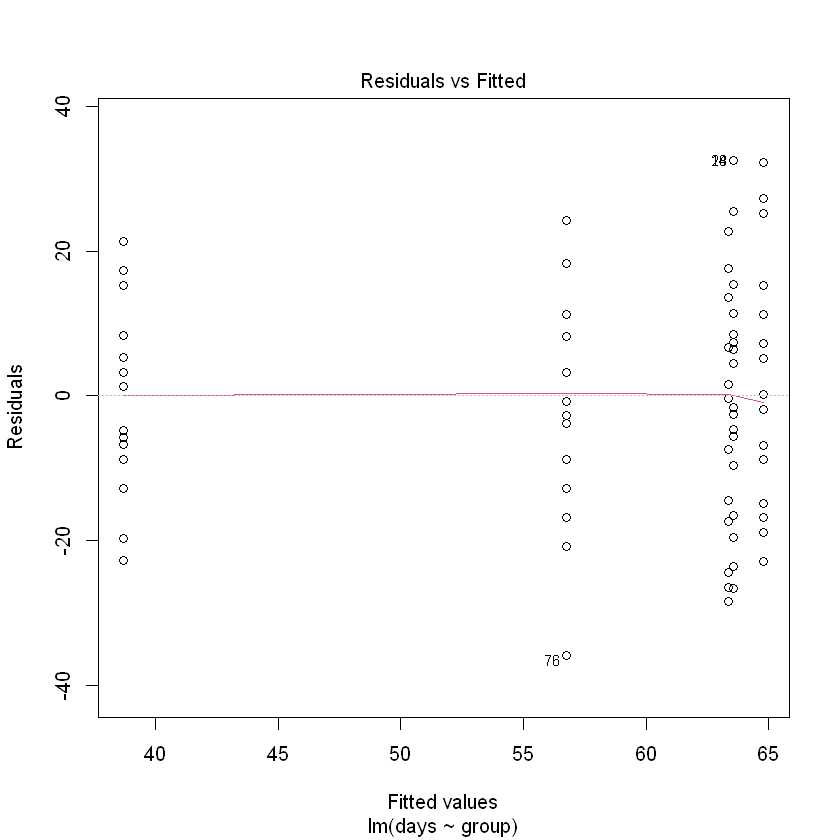
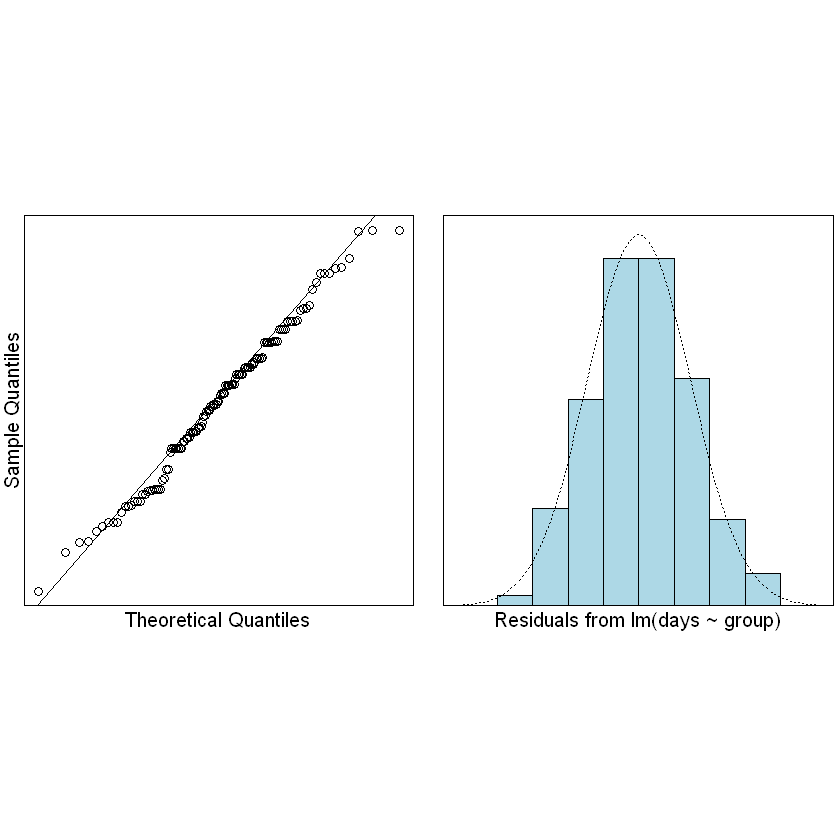
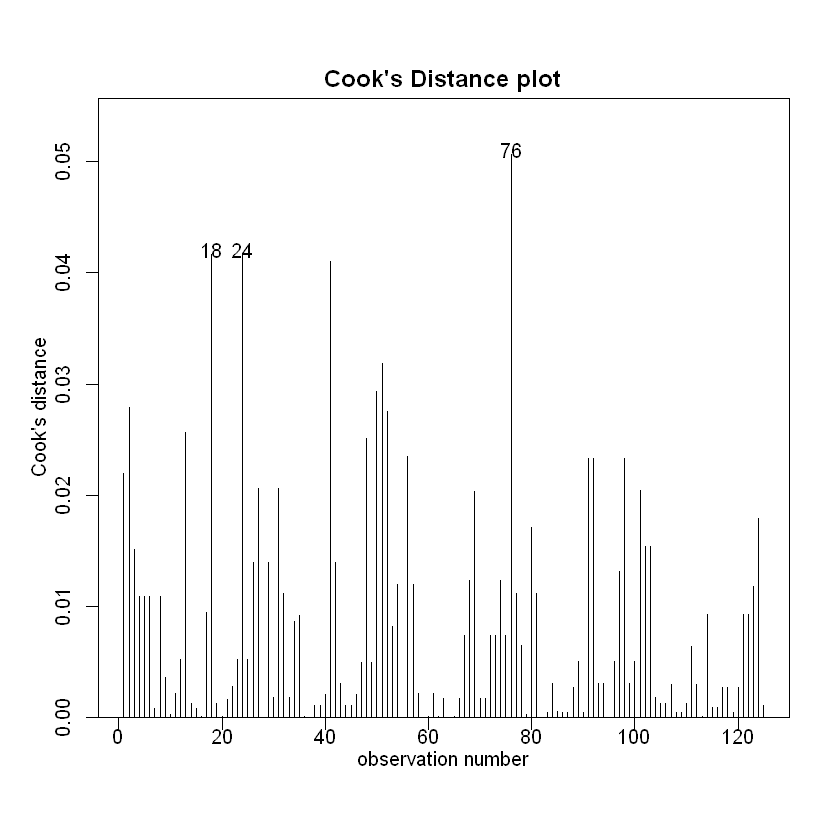
We can trust the fitted model. What can we conclude?
anova(Fruitfly.fit)
| Df | Sum Sq | Mean Sq | F value | Pr(>F) | |
|---|---|---|---|---|---|
| <int> | <dbl> | <dbl> | <dbl> | <dbl> | |
| group | 4 | 11939.28 | 2984.8200 | 13.61195 | 3.515622e-09 |
| Residuals | 120 | 26313.52 | 219.2793 | NA | NA |
11.2. Interpreting the output#
summary(Fruitfly.fit)
Call:
lm(formula = days ~ group, data = Fruitfly.df)

Residuals:
   Min     1Q Median     3Q    Max
-35.76  -8.76   0.20  11.20  32.44

Coefficients:
            Estimate Std. Error t value Pr(>|t|)
(Intercept)   63.560      2.962  21.461  < 2e-16 ***
groupG2        1.240      4.188   0.296    0.768
groupG3       -0.200      4.188  -0.048    0.962
groupG4       -6.800      4.188  -1.624    0.107
groupG5      -24.840      4.188  -5.931 2.98e-08 ***
---
Signif. codes:  0 '***' 0.001 '**' 0.01 '*' 0.05 '.' 0.1 ' ' 1

Residual standard error: 14.81 on 120 degrees of freedom
Multiple R-squared:  0.3121,	Adjusted R-squared:  0.2892
F-statistic: 13.61 on 4 and 120 DF,  p-value: 3.516e-09
Some researchers like to examine the group means and their deviations from the overall (or so-called“grand”) mean. 一些研究人员喜欢检查群体平均数及其与总体(或所谓的“大”)平均数的偏差。These deviations are commonly called group “effects”.
grand.mean <- mean(Fruitfly.df$days)
grand.mean
The estimated group means are just the sample means within each group. 7 We can quickly obtain these using the incredibly useful dplyr package:估计组意味着只是在每组样本均值。我们可以快速获得这些使用非常有用的包:
library(dplyr())
Df <- Fruitfly.df |>
    group_by(group) |>
    summarize(group.mean = mean(days)) |>
    data.frame()
Warning message:
"程辑包'dplyr'是用R版本4.2.3 来建造的"

载入程辑包:'dplyr'


The following objects are masked from 'package:stats':

    filter, lag


The following objects are masked from 'package:base':

    intersect, setdiff, setequal, union
The estimated group means are:
Df$group.mean
Df$group.mean - grand.mean
- 63.56
- 64.8
- 63.36
- 56.76
- 38.72
- 6.12
- 7.36
- 5.92
- -0.68
- -18.72
11.3. The multiple comparisons problem#
The following R code fits a simple linear regression model to iid (independent and identically distributed) normal data.
x <- 1:30 ## Our explanatory variable
y <- rnorm(30) ## y has NO relationship with x
summary(lm(y ~ x))$coef ## Print only the coefficient table
| Estimate | Std. Error | t value | Pr(>|t|) | |
|---|---|---|---|---|
| (Intercept) | -0.51763352 | 0.37980672 | -1.3628867 | 0.1837793 |
| x | 0.02053823 | 0.02139403 | 0.9599985 | 0.3452731 |
如果多次运行此代码,会发现大约5%的时间斜率会满足 p-value < 0.05。
Let’s get simultaneous 95% confidence intervals for all 10 comparisons via the pairs and emmeans functions of the package.
library(emmeans)
Fruitfly.pairs = pairs(emmeans(Fruitfly.fit, ~group, infer = T))
Fruitfly.pairs
Warning message:
"程辑包'emmeans'是用R版本4.2.3 来建造的"
 contrast estimate   SE  df t.ratio p.value
 G1 - G2     -1.24 4.19 120  -0.296  0.9983
 G1 - G3      0.20 4.19 120   0.048  1.0000
 G1 - G4      6.80 4.19 120   1.624  0.4854
 G1 - G5     24.84 4.19 120   5.931  <.0001
 G2 - G3      1.44 4.19 120   0.344  0.9970
 G2 - G4      8.04 4.19 120   1.920  0.3127
 G2 - G5     26.08 4.19 120   6.227  <.0001
 G3 - G4      6.60 4.19 120   1.576  0.5158
 G3 - G5     24.64 4.19 120   5.883  <.0001
 G4 - G5     18.04 4.19 120   4.307  0.0003

P value adjustment: tukey method for comparing a family of 5 estimates